The price of oil, or the oil price, generally refers to the spot price of a barrel of benchmark crude oil—a reference price for buyers and sellers of crude oil such as West Texas Intermediate (WTI), Brent Crude, Dubai Crude, OPEC Reference Basket, Tapis crude, Bonny Light, Urals oil, Isthmus and Western Canadian Select (WCS).[1][2] There is a differential in the price of a barrel of oil based on its grade—determined by factors such as its specific gravity or API gravity and its sulfur content—and its location—for example, its proximity to tidewater and refineries. Heavier, sour crude oils lacking in tidewater access—such as Western Canadian Select—are less expensive than lighter, sweeter oil—such as WTI.

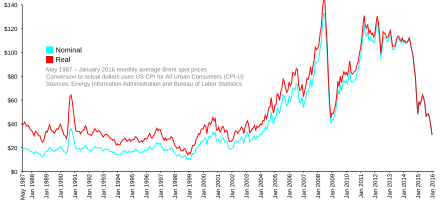
The price of oil rose dramatically from US$50 in early 2007, to a peak of US$147 in July 2008, before plunging to US$34 in December 2008, as the financial crisis of 2007–2008 took hold.[3]:46
According to a January 2020 EIA report, the average price of Brent crude oil in 2019 was $64 per barrel compared to $71 per barrel in 2018. The average price of WTI crude oil was $57 per barrel in 2019 compared to $64 in 2018.[4]
On 20 April, WTI Crude futures contracts dropped below $0 for the first time in history,[5] and the following day Brent Crude fell below $20 per barrel. The substantial decrease in the price of oil was caused by two main factors: the 2020 Russia–Saudi Arabia oil price war[6] and the COVID-19 pandemic, which lowered demand for oil because of lockdowns around the world.[6] In the fall of 2020, against the backdrop of the resurgent pandemic, the U.S. Energy Information Administration (EIA) reported that global oil inventories remained "quite high" while demand for gasoline—particularly in the United States—was "particularly worrisome."[7] The price of oil was about US$40 by mid-October.[8]
Overview
According to Our World in Data, in the nineteenth and early twentieth century the global crude oil prices were "relatively consistent."[9] In the 1970s, there was a "significant increase" in the price of oil globally,[9] partially in response to the 1973 and 1979 oil crises. In 1980, globally averaged prices "spiked" to US$107.27.[9] In the early 1980s, concurrent with the OPEC embargo, oil prices experienced a "rapid decline."[10][9]
In early 2007, the price of oil was US$50. By July 2008 it reached its all-time peak of US$147. In December 2008, the price of oil plunged to US$34, as the financial crisis of 2007–2008 took hold.[3] The global average price of oil dropped to US$43.73 per barrel in 2016.[9]
By April 2020 the price of WTI dropped by 80%, down to a low of about $5,[11] due to the COVID-19 pandemic and the 2020 Russia–Saudi Arabia oil price war.[12][13][14] BBC reported that by April, the price of US oil had "turned negative" as the demand for fuel decreased globally with pandemic-related lockdowns preventing travel.[15] In April, as the demand decreased, concerns about inadequate storage capacity resulted in oil firms "renting tankers to store the surplus supply".[15] An October Bloomberg report on slumping oil prices—citing the EIA among others—said that, with the increasing number of virus cases, the demand for gasoline—particularly in the United States—was "particularly worrisome", while global inventories remained "quite high".[7]
By mid-October, the pandemic continued to threaten demand for oil keeping the price of oil "stuck" at about US$40.[8]
The oil prices were seen rising to hit $71.38 per barrel in March 2021, marking the highest since the beginning of the pandemic in January 2020.[16] The oil price rise followed a missile drone attack on Saudi Arabia's Aramco oil facility by Yemen’s Houthi rebels.[17] The United States said it was committed to defending the country.[18]
Analyses of oil price fluctuations

Global oil prices are determined by the forces of supply and demand,[19] according to the classical economic model of price determination in microeconomics. The demand for oil is highly dependent on global macroeconomic conditions.[19] According to the International Energy Agency, high oil prices generally have a large negative impact on global economic growth.[19]
In response to the 1973 oil crisis, in 1974, the RAND Corporation presented a new economic model of the global oil market that included four sectors—"crude production, transportation, refining, and consumption of products" and these regions—United States, Canada, Latin America, Europe, the Middle East and Africa, and Asia.[20] The study listed exogenous variables that can affect the price of oil: "regional supply and demand equations, the technology of refining, and government policy variables". Based on these exogenous variables, their proposed economic model would be able to determine the "levels of consumption, production, and price for each commodity in each region, the pattern of world trade flows, and the refinery capital structure and output in each region".[20]
A system dynamics economic model of oil price determination "integrates various factors affecting" the dynamics of the price of oil, according to a 1992 European Journal of Operational Research article.[21]
A widely cited 2008 The Review of Economics and Statistics, article by Lutz Killian, examined the extent to which "exogenous oil supply shocks"—such as the Iranian revolution (1978/79), Iran-Iraq War (1980-1988), Persian Gulf War (1990/91), Iraq War (2003), Civil unrest in Venezuela (2002/03), and perhaps the Yom Kippur War/Arab oil embargo (1973/74)"—explain changes in the price of oil."[22] Killian stated that, by 2008, there was "widespread recognition" that "oil prices since 1973 must be considered endogenous with respect to global macroeconomic conditions,"[22] but Kilian added that these "standard theoretical models of the transmission of oil price shocks that maintain that everything else remains fixed, as the real price of imported crude oil increases, are misleading and must be replaced by models that allow for the endogenous determination of the price of oil."
In a 2014 Journal of International Money and Finance article, Lutz said described different types of shocks that affected the real price of oil—shocks to the "flow supply of oil", to the "flow demand for crude oil that reflect the state of the global business cycle," and to the "speculative demand for oil stocks above the ground", and "on other more idiosyncratic oil demand shocks".[23] In this article he examined how one of the challenges for researchers was to identify problems and quantify "speculative oil demand shocks."[23]
By 2016, despite improved understanding of oil markets, predicting oil price fluctuations remained a challenge for economists, according to a 2016 article in the Journal of Economic Perspectives , which was based on an extensive review of academic literature by economists on "all major oil price fluctuations between 1973 and 2014".[24]
A 2016 article in the Oxford Institute for Energy Studies describes how analysts offered differing views on why[25] the price of oil had decreased 55% from "June 2014 to January 2015"[26]:10 following "four years of relative stability at around US$105 per barrel".[26]:41 A 2015 World Bank report said that the low prices "likely marks the end of the commodity supercycle that began in the early 2000s" and they expected prices to "remain low for a considerable period of time".[26]:4 Goldman Sachs, for example, has called this structural shift, the "New Oil Order"—created by the U.S. shale revolution.[27] Goldman Sachs said that this structural shift was "reshaping global energy markets and bringing with it a new era of volatility" by "impacting markets, economies, industries and companies worldwide" and will keep the price of oil lower for a prolonged period.[28] Others say that this cycle is like previous cycles and that prices will rise again.[25]
Benchmark pricing
Major benchmark references, or pricing markers, include Brent, WTI,[29] the OPEC Reference Basket (ORB)—introduced on 16 June 2005 and is made up of Saharan Blend (from Algeria), Girassol (from Angola), Oriente (from Ecuador), Rabi Light (from Gabon), Iran Heavy (from Iran),
- Basra Light (from Iraq), Kuwait Export (from Kuwait), Es Sider (from Libya), Bonny Light (from Nigeria), Qatar Marine (from Qatar), Arab Light (from Saudi Arabia), Murban (from UAE), and Merey (from Venezuela),[30] Dubai Crude, and Tapis Crude (Singapore).
In North America the benchmark price refers to the spot price of West Texas Intermediate (WTI), also known as Texas Light Sweet, a type of crude oil used as a benchmark in oil pricing and the underlying commodity of New York Mercantile Exchange's oil futures contracts. WTI is a light crude oil, lighter than Brent Crude oil. It contains about 0.24% sulfur, rating it a sweet crude, sweeter than Brent.[31] Its properties and production site make it ideal for being refined in the United States, mostly in the Midwest and Gulf Coast regions. WTI has an API gravity of around 39.6 (specific gravity approx. 0.827) per barrel (159 liters) of either WTI/light crude as traded on the New York Mercantile Exchange (NYMEX) for delivery at Cushing, Oklahoma.[32] Cushing, Oklahoma, a major oil supply hub connecting oil suppliers to the Gulf Coast, has become the most significant trading hub for crude oil in North America.
In Europe and some other parts of the world, the price of the oil benchmark is Brent Crude as traded on the Intercontinental Exchange (ICE, into which the International Petroleum Exchange has been incorporated) for delivery at Sullom Voe. Brent oil is produced in coastal waters (North Sea) of UK and Norway. The total consumption of crude oil in UK and Norway is more than the oil production in these countries.[33] So Brent crude market is very opaque with very low oil trade physically.[34][35][36] Brent price is used widely to fix the prices of crude oil, LPG, LNG, natural gas, etc. trade globally including Middle East crude oils.[37]
The Energy Information Administration (EIA) uses the imported refiner acquisition cost, the weighted average cost of all oil imported into the US, as its "world oil price".
Global oil prices: a chronology

The price of oil remained "relatively consistent" from 1861 until the 1970s.[9] In Daniel Yergin's 1991 Pulitzer prize-winning book The Prize: The Epic Quest for Oil, Money, and Power, Yergin described how the "oil-supply management system"—which had been run by "international oil companies"—had "crumbled" in 1973.[38]:599 Yergin states that the role of Organization of the Petroleum Exporting Countries (OPEC)—which had been established in 1960, by Iran, Iraq, Kuwait, Saudi Arabia and Venezuela[39][38]:499[40][10]— in controlling the price of oil, was dramatically changed. Since 1927, a cartel known as the "Seven Sisters"—five of which were headquartered in the United States—had been controlling posted prices since the so-called 1927 Red Line Agreement and 1928 Achnacarry Agreement, and had achieved a high level of price stability until 1972, according to Yergin.[38] By December 2018, OPEC members controlled approximately 72% of total world proved oil reserves, and produced about 41% of the total global crude oil supply.[41]
There were two major energy crisis in the 1970s: the 1973 oil crisis and the 1979 energy crisis that affected the price of oil. Starting in the early 1970s—when domestic production of oil was insufficient to satisfy increasing domestic demands—the US had become increasingly dependent on oil imports from the Middle East.[38] Until the early 1970s, the price of oil in the United States was regulated domestically and indirectly by the Seven Sisters. The "magnitude" of the increase in the price of oil following OPEC's 1973 embargo in reaction to the Yom Kippur War and the 1979 Iranian Revolution, was without precedent.[24] In the 1973 Yom Kippur War, a coalition of Arab states led by Egypt and Syria attacked Israel.[38]:570 During the ensuing 1973 oil crisis, the Arab oil-producing states began to embargo oil shipments to Western Europe and the United States in retaliation for supporting Israel. Countries, including the United States, Germany, Japan,[42] and Canada[43] began to establish their own national energy programs that were focused on security of supply of oil,[38]:607 as the newly formed Organization of Petroleum Exporting Countries (OPEC) doubled the price of oil.[38]:607
During the 1979 oil crisis, the global oil supply was "constrained" because of the 1979 Iranian Revolution—the price of oil "more than doubled",[44] then began to decline in "real terms from 1980 onwards, eroding Opec's power over the global economy," according to The Economist. prices started to fall in real terms from 1980 onwards, eroding OPEC's power over the global economy.[44]
The 1970s oil crisis gave rise to speculative trading and the WTI crude oil futures markets.[45][46]
The 1980s oil glut was caused by non-OPEC countries—such as the United States and Britain—increasing their oil production, which resulted in a decrease in the price of oil in the early 1980s, according to The Economist.[44] When OPEC changed their policy to increase oil supplies in 1985, "oil prices collapsed and remained low for almost two decades", according to a 2015 World Bank report.[26]:10[47]
In 1983, the New York Mercantile Exchange (NYMEX) launched crude oil futures contracts, and the London-based International Petroleum Exchange (IPE)—acquired by Intercontinental Exchange (ICE) in 2005— launched theirs in June 1988.[48]
The price of oil reached a peak of c. US$65 during the 1990 Persian Gulf crisis and war. The 1990 oil price shock occurred in response to the Iraqi invasion of Kuwait, according to the Brookings Institute.[49]
There was a period of global recessions and the price of oil hit a low of c. $15 before it peaked at a high of $45 on 11 September 2001, the day of the September 11 attacks,[50] only to drop again to a low of $26 on 8 May 2003.[51]
The price rose to $80 with the U.S.-led invasion of Iraq.
There were major energy crises in the 2000s including the 2010s oil glut with changes in the world oil pmarket.

From 1999 until mid 2008, the price of oil rose significantly. It was explained by the rising oil demand in countries like China and India.[52]
By May 2008, The United States was consuming approximately 21 million bpd and importing about 14 million bpd—60% with OPEC supply 16% and Venezuela 10%.[53]In the middle of the financial crisis of 2007–2008, the price of oil underwent a significant decrease after the record peak of US$147.27 it reached on 11 July 2008. On 23 December 2008, WTI crude oil spot price fell to US$30.28 a barrel, the lowest since the financial crisis of 2007–2008 began. The price sharply rebounded after the crisis and rose to US$82 a barrel in 2009.[54][55]
On 31 January 2011, the Brent price hit $100 a barrel briefly for the first time since October 2008, on concerns that the 2011 Egyptian protests would "lead to the closure of the Suez Canal and disrupt oil supplies".[56] For about three and half years the price largely remained in the $90–$120 range.
From 2004 to 2014, OPEC was setting the global price of oil.[57] OPEC started setting a target price range of $100–110/bbl before the 2008 financial crisis[26]:10 —by July 2008 the price of oil had reached its all-time peak of US$147 before it plunged to US$34 in December 2008, during the financial crisis of 2007–2008.[3]:46 Some commentators including Business Week, the Financial Times and the Washington Post, argued that the rise in oil prices prior to the financial crisis of 2007–2008 was due to speculation in futures markets.[58][59][60][61][62][63]
Up until 2014, the dominant factor on the price of oil was from the demand side—from "China and other emerging economies".[64][65]
By 2014, hydraulic fracturing in the United States and oil production in Canada, caused oil production to surge globally "on a scale that most oil exporters had not anticipated" resulting in "turmoil in prices."[64] The United States oil production was greater than that of Russia and Saudi Arabia, and according to some, broke OPEC's control of the price of oil.[57] In the middle of 2014, price started declining due to a significant increase in oil production in USA, and declining demand in the emerging countries.[66] According to Ambrose Evans-Pritchard, in 2014–2015, Saudi Arabia flooded the market with inexpensive crude oil in a failed attempted to slow down US shale oil production, and caused a "positive supply shock" which saved consumers about US$2 trillion and "benefited the world economy".[67]
During 2014–2015, OPEC members consistently exceeded their production ceiling, and China experienced a marked slowdown in economic growth. At the same time, U.S. oil production nearly doubled from 2008 levels, due to substantial improvements in shale "fracking" technology in response to record oil prices. A combination of factors led a plunge in U.S. oil import requirements and a record high volume of worldwide oil inventories in storage, and a collapse in oil prices that continues into 2016.[68][69] Between June 2014 and January 2015, according to the World Bank, the collapse in the price of oil was the third largest since 1986.[25]
In early 2015, the US oil price fell below $50 per barrel dragging Brent oil to just below $50 as well.[70]
The 2010s oil glut—caused by multiple factors—spurred a sharp downward spiral in the price of oil that continued through February 2016.[71] By 3 February 2016 oil was below $30—[72] a drop of "almost 75% since mid-2014 as competing producers pumped 1–2 million barrels of crude daily exceeding demand, just as China's economy hit lowest growth in a generation."[51] The North Sea oil and gas industry was financially stressed by the reduced oil prices, and called for government support in May 2016.[73] According to a report released on 15 February 2016 by Deloitte LLP—the audit and consulting firm—with global crude oil at near ten-year low prices, 35% of listed E&P oil and gas companies are at a high risk of bankruptcy worldwide.[74][75] Indeed, bankruptcies "in the oil and gas industry could surpass levels seen in the Great Recession."[74][76]
In June 2018, OPEC reduced production.[77] In late September and early October 2018, the price of oil rose to a four-year high of over $80 for the benchmark Brent crude[77] in response to concerns about constraints on global supply. The production capacity in Venezuela had decreased. United States sanctions against Iran, OPEC's third-biggest oil producer, were set to be restored and tightened in November.[78]
The price of oil dropped in November 2018 because of a number of factors, including "rising petro-nations’ oil production, the U.S. shale oil boom, and swelling North American oil inventories," according to Market Watch.[79]
The 1 November 2018 U.S. Energy Information Administration (EIA) report announced that the US had become the "leading crude oil producer in the world" when it hit a production level of 11.3 million barrels per day (bpd) in August 2018, mainly because of its shale oil production.[80] US exports of petroleum—crude oil and products—exceeded imports in September and October 2019, "for the first time on record, based on monthly values since 1973."[4]
When the price of Brent oil dropped rapidly in November, 2018 to $58.71,[81] more than 30% from its peak,[82]—the biggest 30-day drop since 2008—factors included increased oil production in Russia, some OPEC countries and the United States, which deepened global over supply, were factors in the crash.[81]
In 2019 the average price of Brent crude oil in 2019 was $64, WTI crude oil was $57,[4] the OPEC Reference Basket (ORB) of 14 crudes was $59.48 a barrel.[83]

In 2020, the economic turmoil caused by the COVID-19 recession, included severe impacts on crude oil markets,[84] which caused a large stock market fall.[13] The substantial decrease in the price of oil was caused by two main factors: the 2020 Russia–Saudi Arabia oil price war[6] and the COVID-19 pandemic, which lowered demand for oil because of lockdowns around the world.[6]
The IHS Market reported that the "COVID-19 demand shock" represented a bigger contraction than that experienced during the Great Recession during the late 2000s and early 2010s.[67] As demand for oil dropped to 4.5m million bpd below forecasts, tensions rose between OPEC members.[67] At a 6 March OPEC meeting in Vienna, major oil producers were unable to agree on reducing oil production in response to the global COVID-19 pandemic.[13] The spot price of WTI benchmark crude oil on the NYM on 6 March 2020 dropped to US$42.10 per barrel.[85] On 8 March, the 2020 Russia–Saudi Arabia oil price war was launched, in which Saudi Arabia and Russia briefly flooded the market, also contributed to the decline in global oil prices.[86] Later on the same day, oil prices had decreased by 30%, representing the largest one-time drop since the 1991 Gulf War.[14] Oil traded at about $30 a barrel.[14] Very few energy companies can produce oil when the price of oil is this low. Saudi Arabia, Iran, and Iraq had the lowest production costs in 2016, while the United Kingdom, Brazil, Nigeria, Venezuela, and Canada had the highest.[87] On 9 April, Saudi Arabia and Russia agreed to oil production cuts.[88][89]
and the COVID-19 pandemic, which lowered demand for oil because of lockdowns around the world.[6][11][12][13][14][90][91]
On 20 April, due to excessive demand for storage of the large surplus in production, the price for future delivery of US crude in May had become negative, the first time to happen since the New York Mercantile Exchange began trading in 1983.[92][93] With the price of WTI at a record low, and 2019 Chinese 5% import tariff on U.S. oil lifted by China in May 2020, China began to import large quantities of US crude oil, reaching a record high of 867,000 bpd in July.[94]
Oil-storage trade (contango)
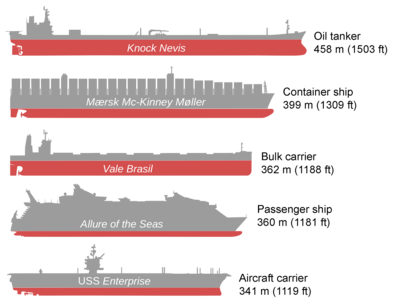
The oil-storage trade, also referred to as contango, a market strategy in which large, often vertically-integrated oil companies purchase oil for immediate delivery and storage—when the price of oil is low— and hold it in storage until the price of oil increases. Investors bet on the future of oil prices through a financial instrument, oil futures in which they agree on a contract basis, to buy or sell oil at a set date in the future. Crude oil is stored in salt mines, tanks and oil tankers.[95]
Investors can choose to take profits or losses prior to the oil-delivery date arrives. Or they can leave the contract in place and physical oil is "delivered on the set date" to an "officially designated delivery point", in the United States, that is usually Cushing, Oklahoma. When delivery dates approach, they close out existing contracts and sell new ones for future delivery of the same oil. The oil never moves out of storage. If the forward market is in "contango"—the forward price is higher than the current spot price—the strategy is very successful.
Scandinavian Tank Storage AB and its founder Lars Jacobsson introduced the concept on the market in early 1990.[96] But it was in 2007 through 2009 the oil storage trade expanded,[97] with many participants—including Wall Street giants, such as Morgan Stanley, Goldman Sachs, and Citicorp—turning sizeable profits simply by sitting on tanks of oil.[98] By May 2007 Cushing's inventory fell by nearly 35% as the oil-storage trade heated up.[98]
By the end of October 2009 one in twelve of the largest oil tankers was being used more for temporary storage of oil, rather than transportation.[99]
From June 2014 to January 2015, as the price of oil dropped 60% and the supply of oil remained high, the world's largest traders in crude oil purchased at least 25 million barrels to store in supertankers to make a profit in the future when prices rise. Trafigura, Vitol, Gunvor, Koch, Shell and other major energy companies began to book oil storage supertankers for up to 12 months. By 13 January 2015 At least 11 Very Large Crude Carriers (VLCC) and Ultra Large Crude Carriers (ULCC)" have been reported as booked with storage options, rising from around five vessels at the end of last week. Each VLCC can hold 2 million barrels."[100]
In 2015 as global capacity for oil storage was out-paced by global oil production, and an oil glut occurred. Crude oil storage space became a tradable commodity with CME Group— which owns NYMEX— offering oil-storage futures contracts in March 2015.[95] Traders and producers can buy and sell the right to store certain types of oil.[101][102]
By 5 March 2015, as oil production outpaces oil demand by 1.5 million bpd, storage capacity globally is dwindling.[95] In the United States alone, according to data from the Energy Information Administration, U.S. crude-oil supplies are at almost 70% of the U. S. storage capacity, the highest to capacity ratio since 1935.[95]
In 2020, rail and road tankers and decommissioned oil pipe lines are also being used to store crude oil for contango trade.[103] For the WTI crude to be delivered in May 2020, the price had fallen to -$40 per bbl (i.e. buyers would be paid by the sellers for taking delivery of crude oil) due to lack of storage/expensive storage.[104] LNG carriers and LNG tanks can also be used for long duration crude oil storage purpose since LNG can not be stored long term due to evaporation. Frac tanks are also used to store crude oil deviating from their normal use.[105]
Comparative cost of production
In their May 2019 comparison of the "cost of supply curve update" in which the Norway-based Rystad Energy—an "independent energy research and consultancy"—ranked the "worlds total recoverable liquid resources by their breakeven price", they listed the "Middle East onshore market" as the "cheapest source of new oil volumes globally" with the "North American tight oil"—which includes onshore shale oil in the United States—in second place.[106] The breakeven price for North American shale oil was US$68 a barrel in 2015, making it one of the most expensive to produce. By 2019, the "average Brent breakeven price for tight oil was about US$46 per barrel. The breakeven price of oil from Saudi Arabia and other Middle Eastern countries was US$42, in comparison.[106]
Rystad reported that the average breakeven price for oil from the oil sands was US$83 in 2019, making it the most expensive to produce, compared to all other "significant oil producing regions" in the world.[106] The International Energy Agency made similar comparisons.[107]
In 2016, the Wall Street Journal reported that the United Kingdom, Brazil, Nigeria, Venezuela, and Canada had the costliest production.[87] Saudi Arabia, Iran, and Iraq had the cheapest.[87]
Future projections
Peak oil is the period when the maximum rate of global petroleum extraction is reached, after which the rate of production enters terminal decline. It relates to a long-term decline in the available supply of petroleum. This, combined with increasing demand, will significantly increase the worldwide prices of petroleum derived products. Most significant will be the availability and price of liquid fuel for transportation.[108]
The US Department of Energy in the Hirsch report indicates that "The problems associated with world oil production peaking will not be temporary, and past "energy crisis" experience will provide relatively little guidance."[109]
Global annual crude oil production (including shale oil, oil sands, lease condensate and gas plant condensate but excluding liquid fuels from other sources such as natural gas liquids, biomass and derivatives of coal and natural gas) increased from 75.86 million barrels (12.1 million cubic metres) in 2008 to 83.16 million bbl (13.2 million m3) per day in 2018 with a marginal annual growth rate of 1%.[110] During the year 2020 crude oil consumption is expected to decrease from earlier year due to Coronavirus disease 2019 pandemic.[111]
Impact of rising oil price
The rising oil prices could negatively impact the world economy.[112] Since supplies of petroleum and natural gas are essential to modern agriculture techniques, a fall in global oil supplies could cause spiking food prices in the coming decades.[108][113] One reason for the increase in food prices in 2007–08 may be the increase in oil prices at the same time.[114]
Impact of declining oil price
A major rise or decline in oil price can have both economic and political impacts. The decline on oil price during 1985–1986 is considered to have contributed to the fall of the Soviet Union.[115] Low oil prices could alleviate some of the negative effects associated with the resource curse, such as authoritarian rule[116][117][118][119][120] and gender inequality.[121][122] Lower oil prices could however also lead to domestic turmoil and diversionary war. The reduction in food prices that follows lower oil prices could have positive impacts on violence globally.[123]
Research shows that declining oil prices make oil-rich states less bellicose.[124] Low oil prices could also make oil-rich states engage more in international cooperation, as they become more dependent on foreign investments.[125] The influence of the United States reportedly increases as oil prices decline, at least judging by the fact that "both oil importers and exporters vote more often with the United States in the United Nations General Assembly" during oil slumps.[123]
The macroeconomics impact on lower oil prices is lower inflation. A lower inflation rate is good for the consumers. This means that the general price of a basket of goods would increase at a bare minimum on a year to year basis. Consumer can benefit as they would have a better purchasing power, which may improve real gdp.[126] However, in recent countries like Japan, the decrease in oil prices may cause deflation and it shows that consumers are not willing to spend even though the prices of goods are decreasing yearly, which indirectly increases the real debt burden.[126] Declining oil prices may boost consumer oriented stocks but may hurt oil-based stocks.[127][128] It is estimated that 17–18% of S&P would decline with declining oil prices.
It has also been argued that the collapse in oil prices in 2015 should be very beneficial for developed western economies, who are generally oil importers and aren't over exposed to declining demand from China.[129] In the Asia-Pacific region, exports and economic growth were at significant risk across economies reliant on commodity exports as an engine of growth. The most vulnerable economies were those with a high dependence on fuel and mineral exports to China, such as: Korea DPR, Mongolia and Turkmenistan—where primary commodity exports account for 59–99% of total exports and more than 50% of total exports are destined to China. The decline in China's demand for commodities also adversely affected the growth of exports and GDP of large commodity-exporting economies such as Australia (minerals) and the Russian Federation (fuel). On the other hand, lower commodity prices led to an improvement in the trade balance—through lower the cost of raw materials and fuels—across commodity importing economies, particularly Cambodia, Kyrgyzstan, Nepal and other remote island nations (Kiribati, Maldives, Micronesia (F.S), Samoa, Tonga, and Tuvalu) which are highly dependent on fuel and agricultural imports.[130]
The oil importing economies like EU, Japan, China or India would benefit, however the oil producing countries would lose.[131][132][133] A Bloomberg article presents results of an analysis by Oxford Economics on the GDP growth of countries as a result of a drop from $84 to $40. It shows the GDP increase between 0.5% to 1.0% for India, USA and China, and a decline of greater than 3.5% from Saudi Arabia and Russia. A stable price of $60 would add 0.5 percentage point to global gross domestic product.
Katina Stefanova has argued that falling oil prices do not imply a recession and a decline in stock prices.[134] Liz Ann Sonders, Chief Investment Strategist at Charles Schwab, had earlier written that that positive impact on consumers and businesses outside of the energy sector, which is a larger portion of the US economy will outweigh the negatives.[135]
While President Trump said in 2018, that the lower price of oil was like a "big Tax Cut for America and the World",[82] The Economist said that rising oil prices had a negative impact on oil-importing countries in terms of international trade.[78] Import prices rise in relation to their exports.[78] The importing country's current account deficits widen because "their exports pay for fewer imports".[78]
Speculative trading and crude oil futures
In the wake of the 1970s oil crisis, speculative trading in crude oil and crude oil futures in the commodity markets emerged.[45][46]
NYMEX launched crude oil futures contracts in 1983, and the IPE launched theirs in June 1988.[48] Global crude oil prices began to be published through NYMEX and IPE crude oil futures market.[48] Volatility in crude oil prices can cause problems for the global economy. These crude oil futures contracts helped mitigate the "economic hazards of international crude oil spot price fluctuations".[48] By 2019, NYMEX and ICE had become "representative of the world crude oil futures market"—an important factor in the world economy.[48] Crude oil futures bring some uncertainty to the market and contribute to crude oil price fluctuations. [48]
By 2008, there were a number of widely traded oil futures market listings.[136]
Speculation during the 2007-2008 financial crisis
According to a U.S. Commodity Futures Trading Commission (CFTC) 29 May 2008 report the "Multiple Energy Market Initiatives" was launched in partnership with the United Kingdom Financial Services Authority and ICE Futures Europe in order to expand surveillance and information sharing of various futures contracts. Part 1 is "Expanded International Surveillance Information for Crude Oil Trading."[62] This announcement received wide coverage in the financial press, with speculation about oil futures price manipulation.[59][60][61] In June 2008 Business Week reported that the surge in oil prices prior to the financial crisis of 2008 had led some commentators to argue that at least some of the rise was due to speculation in the futures markets.[58] The July 2008 interim report by the Interagency Task Force found that speculation had not caused significant changes in oil prices and that the increase in oil prices between January 2003 and June 2008 [were] largely due to fundamental supply and demand factors."[137]:3 The report found that the primary reason for the price increases was that the world economy had expanded at its fastest pace in decades, resulting in substantial increases in the demand for oil, while the oil production grew sluggishly, compounded by production shortfalls in oil-exporting countries.[137]:3
The report stated that as a result of the imbalance and low price elasticity, very large price increases occurred as the market attempted to balance scarce supply against growing demand, particularly from 2005 to 2008.[137]:14 The report forecast that this imbalance would persist in the future,[137]:4 leading to continued upward pressure on oil prices, and that large or rapid movements in oil prices are likely to occur even in the absence of activity by speculators.[137]:4
Hedging using oil derivatives
The use of hedging using commodity derivatives as a risk management tool on price exposure to liquidity and earnings, has been long established in North America. Chief Financial Officers (CFOS) use derivatives to dampen, remove or mitigate price uncertainty.[138] Bankers also use hedge funds to more "safely increase leverage to smaller oil and gas companies."[138] However, when not properly used, "derivatives can multiply losses"[138] particularly in North America where investors are more comfortable with higher levels of risk than in other countries.[138]
With the large number of bankruptcies as reported by Deloitte[76] "funding [for upstream oil industry] is shrinking and hedges are unwinding."[74] "Some oil producers are also choosing to liquidate hedges for a quick infusion of cash, a risky bet."[75]
According to John England, the Vice-Chairman Deloitte LLP, "Access to capital markets, bankers' support and derivatives protection, which helped smooth an otherwise rocky road, are fast waning...The roughly 175 companies at risk of bankruptcy have more than $150 billion in debt, with the slipping value of secondary stock offerings and asset sales further hindering their ability to generate cash."[139]
To finance exploration and production of the unconventional oil industry in the United States, "hundreds of billions of dollars of capital came from non-bank participants [non-bank buyers of bank energy credits] in leveraged loans] that were thought at the time to be low risk.[140] However, with the oil glut that continued into 2016, about a third of oil companies are facing bankruptcy.[76] While investors were aware that there was a risk that the operator might declare bankruptcy, they felt protected because "they had come in at the 'bank' level, where there was a senior claim on the assets [and] they could get their capital returned."[138]
According to a 2012 article in Oil and Gas Financial Journal, "the combination of the development of large resource plays in the US and the emergence of business models designed to ensure consistent dividend payouts to investors has led to the development of more aggressive hedging policies in companies and less restrictive covenants in bank loans."[138]
Institutional investors divesting from oil industry
At the fifth annual World Pensions Forum in 2015, Jeffrey Sachs advised institutional investors to divest from carbon-reliant oil industry firms in their pension fund's portfolio.[141
| This article uses material from the Wikipedia article Metasyntactic variable, which is released under the Creative Commons Attribution-ShareAlike 3.0 Unported License. |